All Projects
Client work, anonymized
2026, ITSM & Automation, Internal Tools
Report Studio: dashboard builder
A dashboard builder for SimpleOne: users assemble their own dashboards from charts, tables and KPIs over any data in the system, with no developer and no queries.
Live2 min read
- Tile kinds
- 14
- Data
- Any table in the system
- Interface
- Agent and portal, RU and EN
Problem
The client wanted a tool where staff build their own dashboards over any data in the system: incidents, requests, SLAs, logs. No developer, no hand-written queries, no separate reporting store.
What was built
- Dashboard registry with search, drafts and publishing.
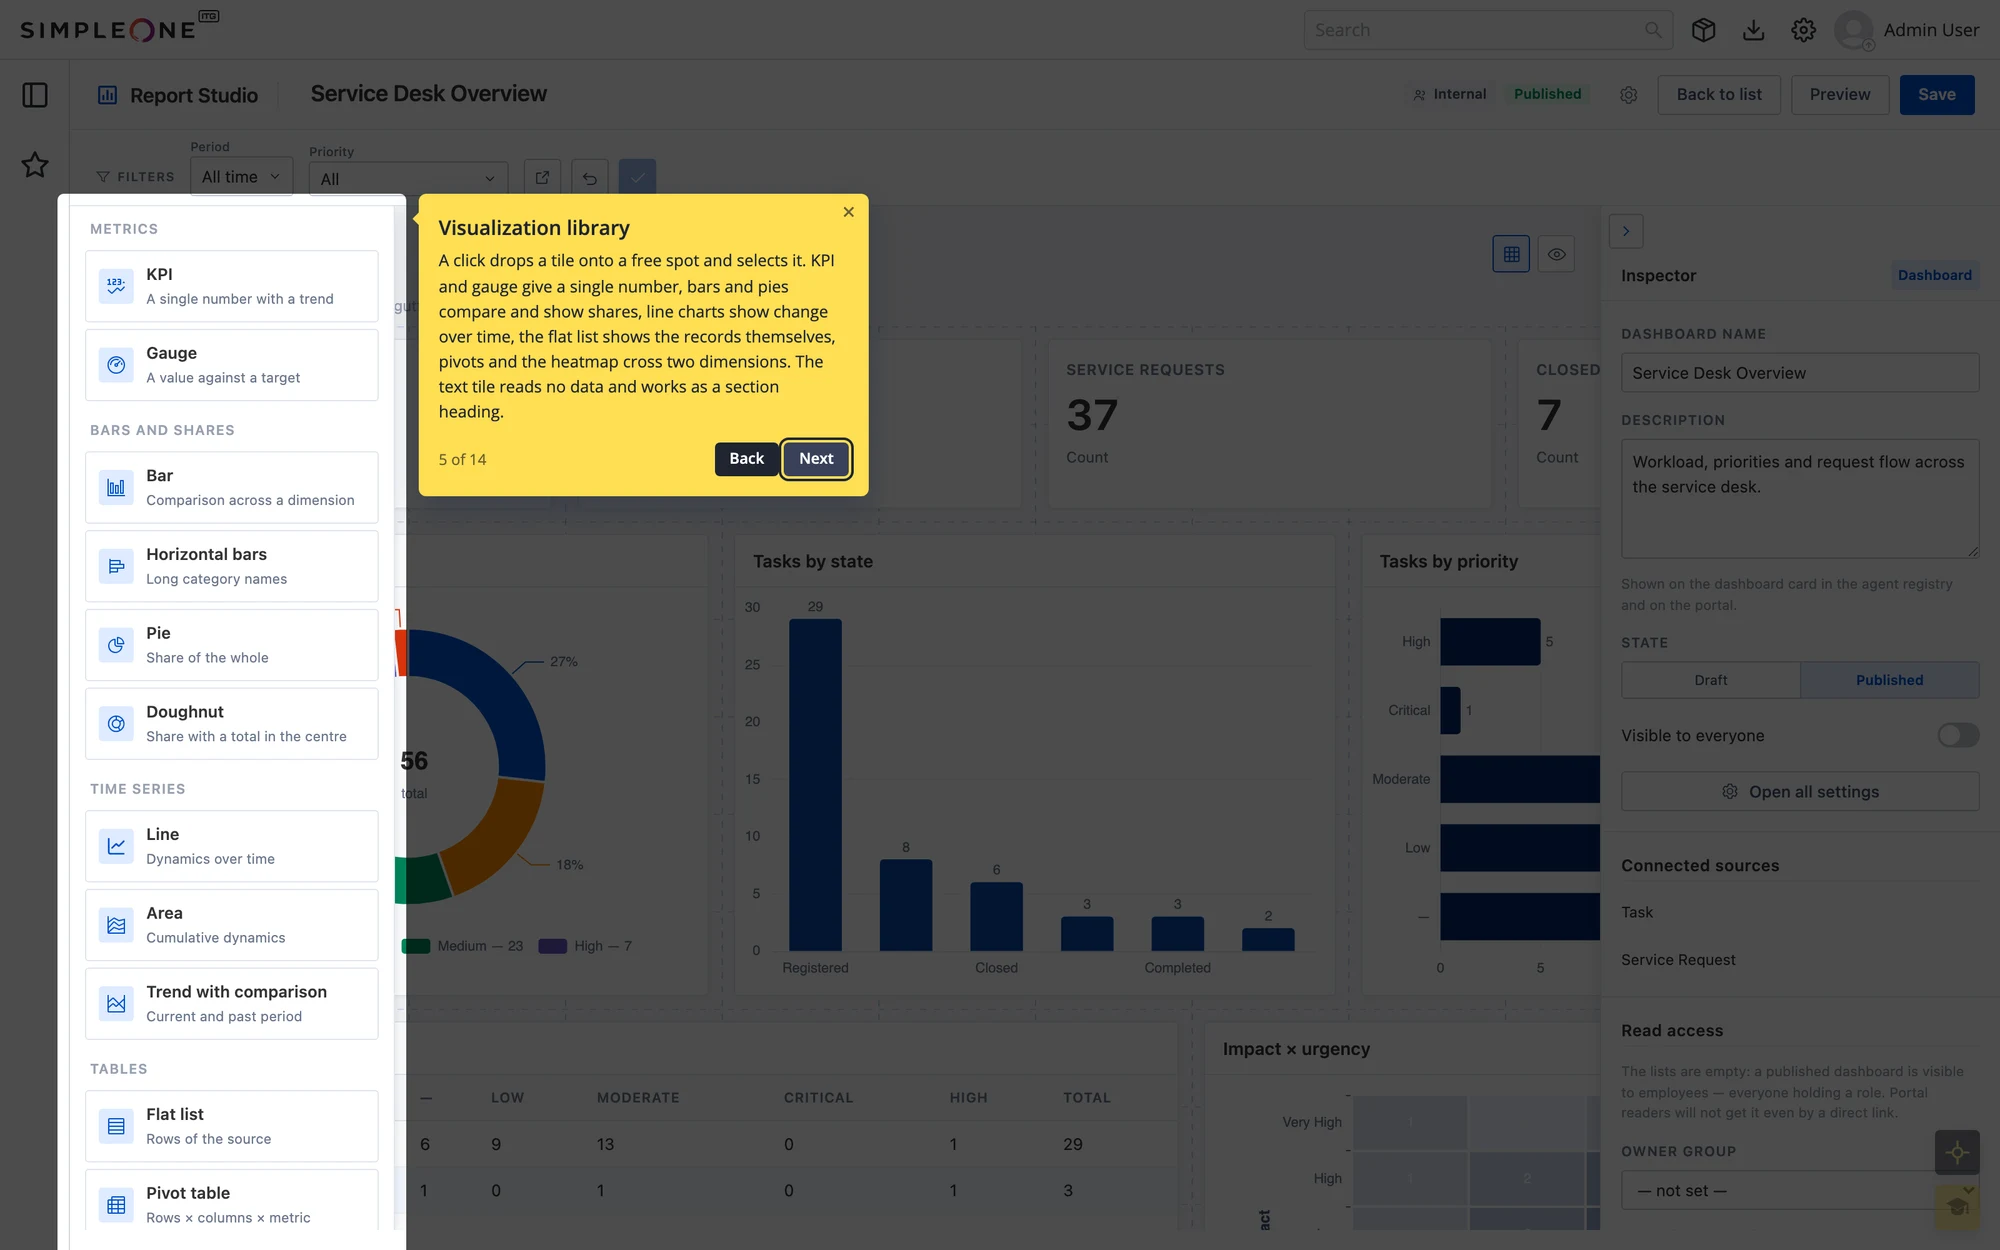
- Editor: a visualization library on the left, the canvas in the middle, settings for the selected tile on the right. Tiles can be dragged, resized and copied into another dashboard.
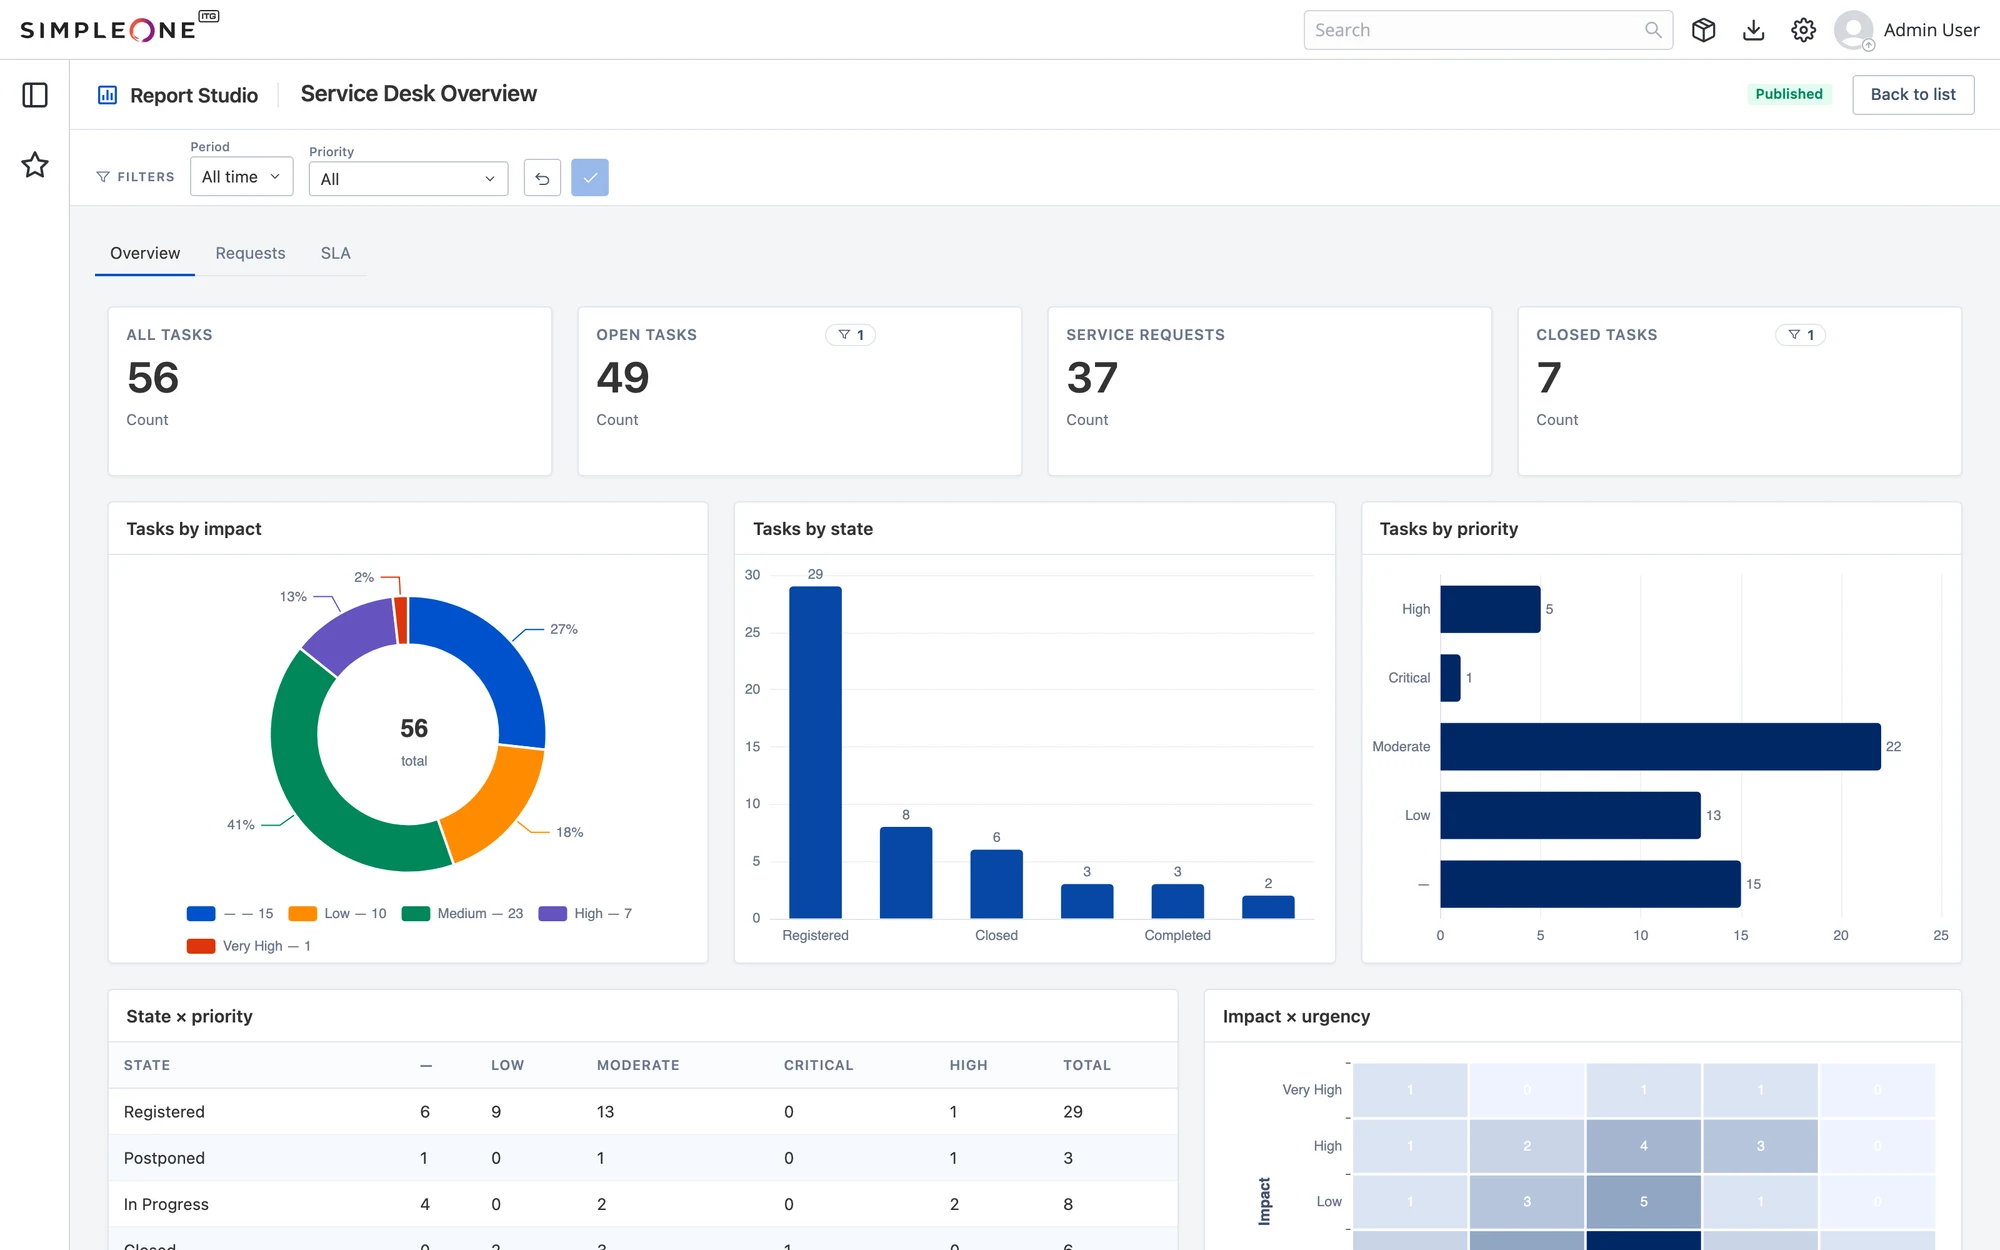
- 14 tile kinds: KPIs with trend, gauge, bars, pie and doughnut charts, lines, period comparison, record lists, pivot tables, heat map, text.
- Calculations: count, sum, average, median, percentile; grouping by field or by time, from an hour to a year.
- Filters for the whole dashboard and conditions for a single tile, including OR.
- Related-table fields and computed fields, such as the time between two dates.
- Tabs, links from a tile to the source records, row grouping in lists.
- Palettes: ready-made sets, a color generator, personal and shared palettes.
- Access: an owner group, reader lists, read-only publishing to the portal.
- Two interface languages, a user guide and a technical description.
How it works
- A dashboard is a single record. It moves to another instance as is, and dashboards from the first versions open without rework.
- Only what's needed is loaded. A dashboard reads just the data its tiles show, and the server computes the final numbers. The editor opens twice as fast, and data loads almost four times faster on a large table.
- Filters were tested on the instance. For some malformed conditions the platform returns the whole table instead of an error. I checked every condition type with real queries and compared tile results with a manual calculation on thousands of random sets.
- Access is decided per dashboard. Its access settings decide who sees it. A link from a tile to the records themselves is offered only to people with rights to that table.
Screenshots
A finished dashboard: filters, tabs, KPIs, charts, a pivot table and a heat map
Editor: visualization library, canvas and settings for the selected tile
A separate dashboard tab: requests by state and urgency
Related projects